Millions of relationships.
One answer: yours.
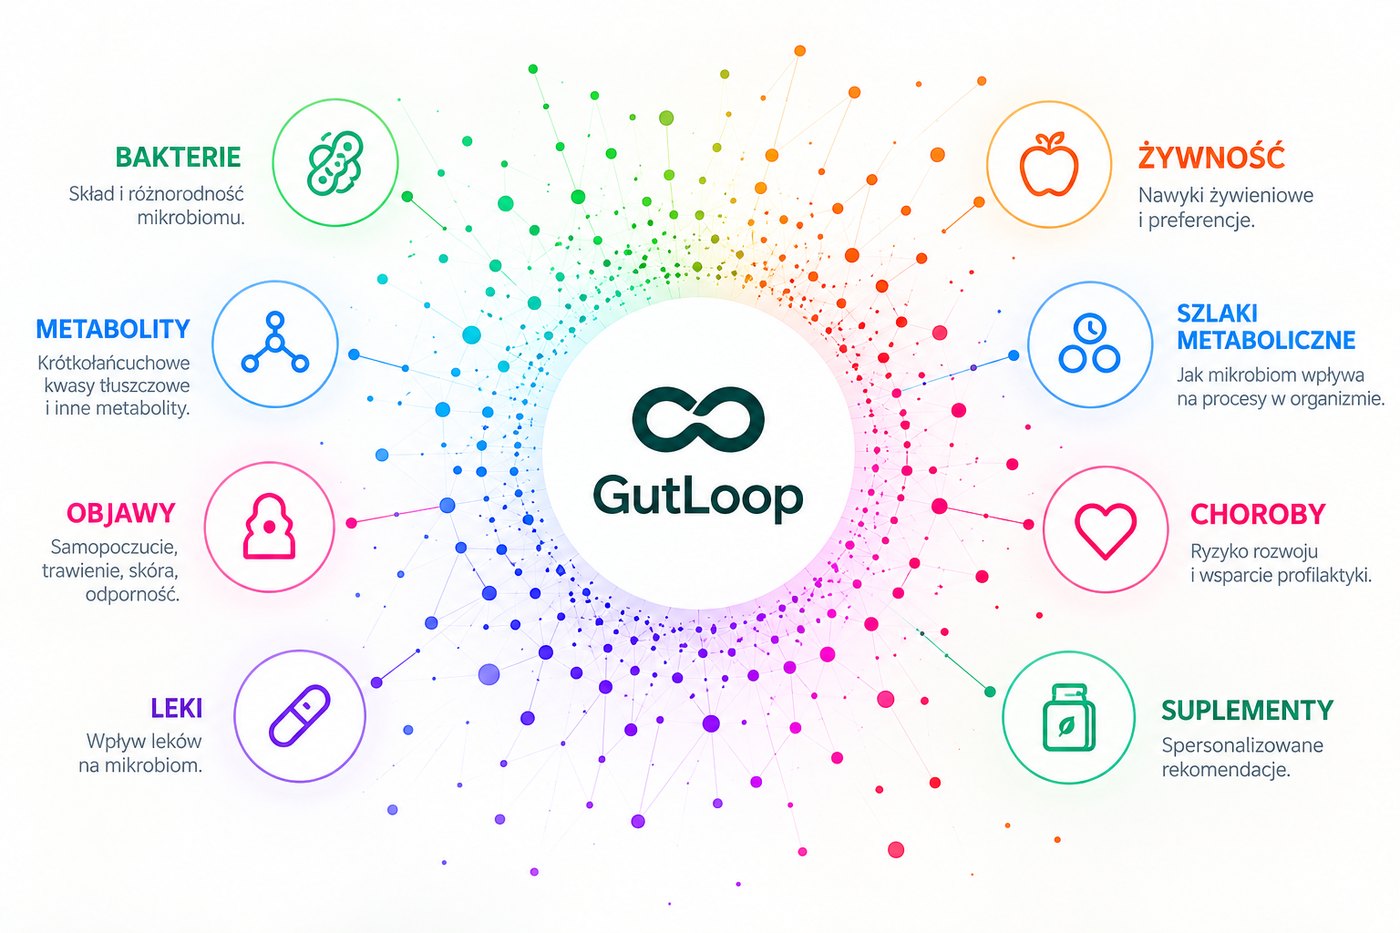
GUT·DIET·MAP is a knowledge graph connecting bacteria, metabolites, food, metabolic pathways, symptoms, diseases, medicines and supplements. AI searches it to extract what matters for you from your result.
knowledge nodes
biological connections
bacterial species
metabolites

What happens to your sample
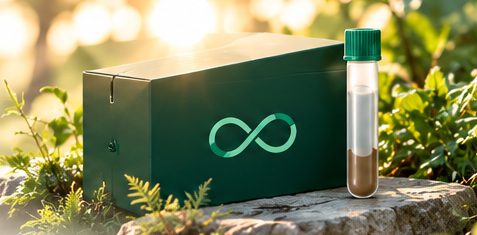
Collection and transport
A tube with a DNA-stabilising buffer. The sample keeps its composition at room temperature.

DNA extraction
Extraction of bacterial genetic material in a partner laboratory (incl. the Polish Academy of Sciences).

16S rRNA sequencing
Reading the 16S rRNA gene region identifies the bacteria and their proportions.
Bioinformatics
Quality control, taxonomic classification, comparison with the reference database.
GUT·DIET·MAP + AI
The result is embedded in the knowledge graph; the model points to indicators, foods and actions.
16S rRNA: a map of the inhabitants of your gut
16S rRNA sequencing answers the question “who lives here and in what proportions”. From that, GUT·DIET·MAP infers which metabolic functions your microbiome may perform and how your diet affects them.
We say plainly what the test shows and what it does not. That builds trust and sets us apart from tests that promise “everything”.
Composition and diversity
Which bacterial genera you have, in what proportions, how diverse the ecosystem is, which functions it may perform (inferred from the map).
Disease diagnoses
The test does not diagnose diseases and does not replace medical tests. It is an educational and nutritional tool.
How we read a path in the graph
Example: low Faecalibacterium → less butyrate production → weaker gut barrier → symptom: bloating. The map suggests foods rich in prebiotic fibre (e.g. chicory, leek, oats) that support this bacterium.
- Bacteria (10,000+ species)
- Metabolites (5,000+)
- Food and ingredients
- Metabolic pathways
- Symptoms
- Diseases
- Medicines
- Supplements
The science we stand on
Laboratory partners, the team’s publications and the data sources the GUT·DIET·MAP map is built from.
- Polska Akademia Nauk
- SGGW
- Partner laboratory
- Grant programme
- Technology partner
Selected publications
| 2026 · [Title of the team’s publication on the microbiome–diet knowledge graph] | Journal · DOI |
| 2025 · [Title of the publication on 16S rRNA analysis in the Polish population] | Journal · DOI |
| 2024 · [Title of the publication on the AI model for dietary recommendations] | Journal · DOI |
Scientific team
[Name Surname]
[Name Surname]
[Name Surname]
[Name Surname]
Names, affiliations and publications will be completed by the GutLoop scientific team.
Your data. Your property.
Processed in the European Union
Data and samples processed under GDPR, on servers in the EU.
Encryption and pseudonymisation
Results are linked to your account by the kit code, not personal data.
We never sell data
You can download or delete your data at any time. Taking part in research is voluntary.
See what your microbiome wants to tell you
Tested in Poland, 16S rRNA sequencing, data processed under GDPR.